You’ve shipped an agent that scores 94% on the latest LLM leaderboard. In production, it takes 37 seconds to decide whether to refund a customer, hallucinates a database table name, and silently drops a critical API call. This gap — between curated benchmarks and messy reality — is the single biggest blind spot in AI engineering today. Static benchmarks are a mirage, and the only way to see what your agents actually do is through observability: tracing every loop, logging every context window, and monitoring every decision path as it unfolds.
The Benchmark Mirage: Why Leaderboards Don’t Reflect Reality
Every week, a new model tops LiveBench or the LLM Leaderboard with a score that makes headlines. Engineers rush to swap models, expecting instant lift. Then the real world hits: the agent that aced math reasoning fails to parse a straightforward CSV column name. The model that scored high on instruction following starts repeating itself after three turns in a conversation.
Benchmarks measure a narrow slice of capability — typically single-turn, well-defined tasks with clean inputs. They don’t test for:
- Multi-step reasoning under ambiguity — an agent that needs to query a database, interpret the result, then decide on a next action.
- Context window degradation — how a model behaves after 50,000 tokens of conversation history.
- Tool-calling reliability — whether the agent consistently formats function calls, handles errors, and retries gracefully.
- Latency and cost in production — the leaderboard doesn’t tell you your agent will cost $0.08 per call and take 12 seconds to respond.
The arXiv survey on LLM benchmarks makes this explicit: most evaluations are static, synthetic, and fail to capture the distribution shifts agents face in real deployments. A model that scores 95% on GSM8K might still fail to book a meeting because it can’t handle timezone conversions across three different calendar APIs.
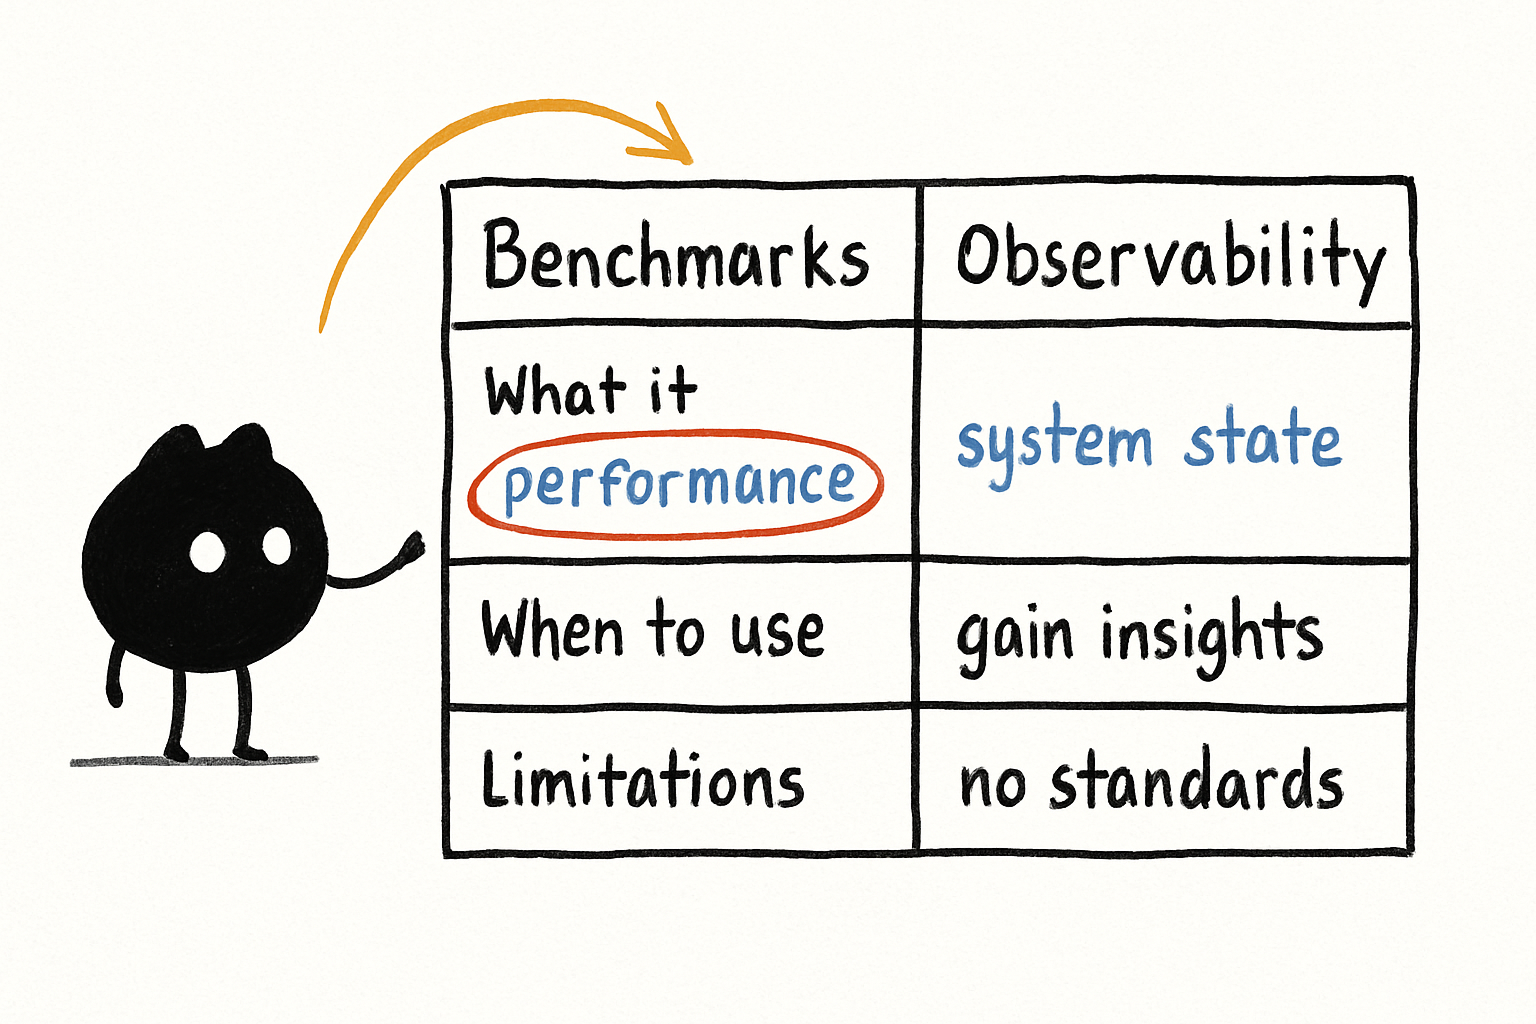
My take: Benchmarks are useful for initial model selection, but they’re a terrible proxy for agent behavior. Treat them like a car’s horsepower rating — interesting, but irrelevant if the steering wheel falls off at highway speed. What matters is how the agent performs in your environment, with your tools, under your load patterns.
What Observability Means for AI Agents
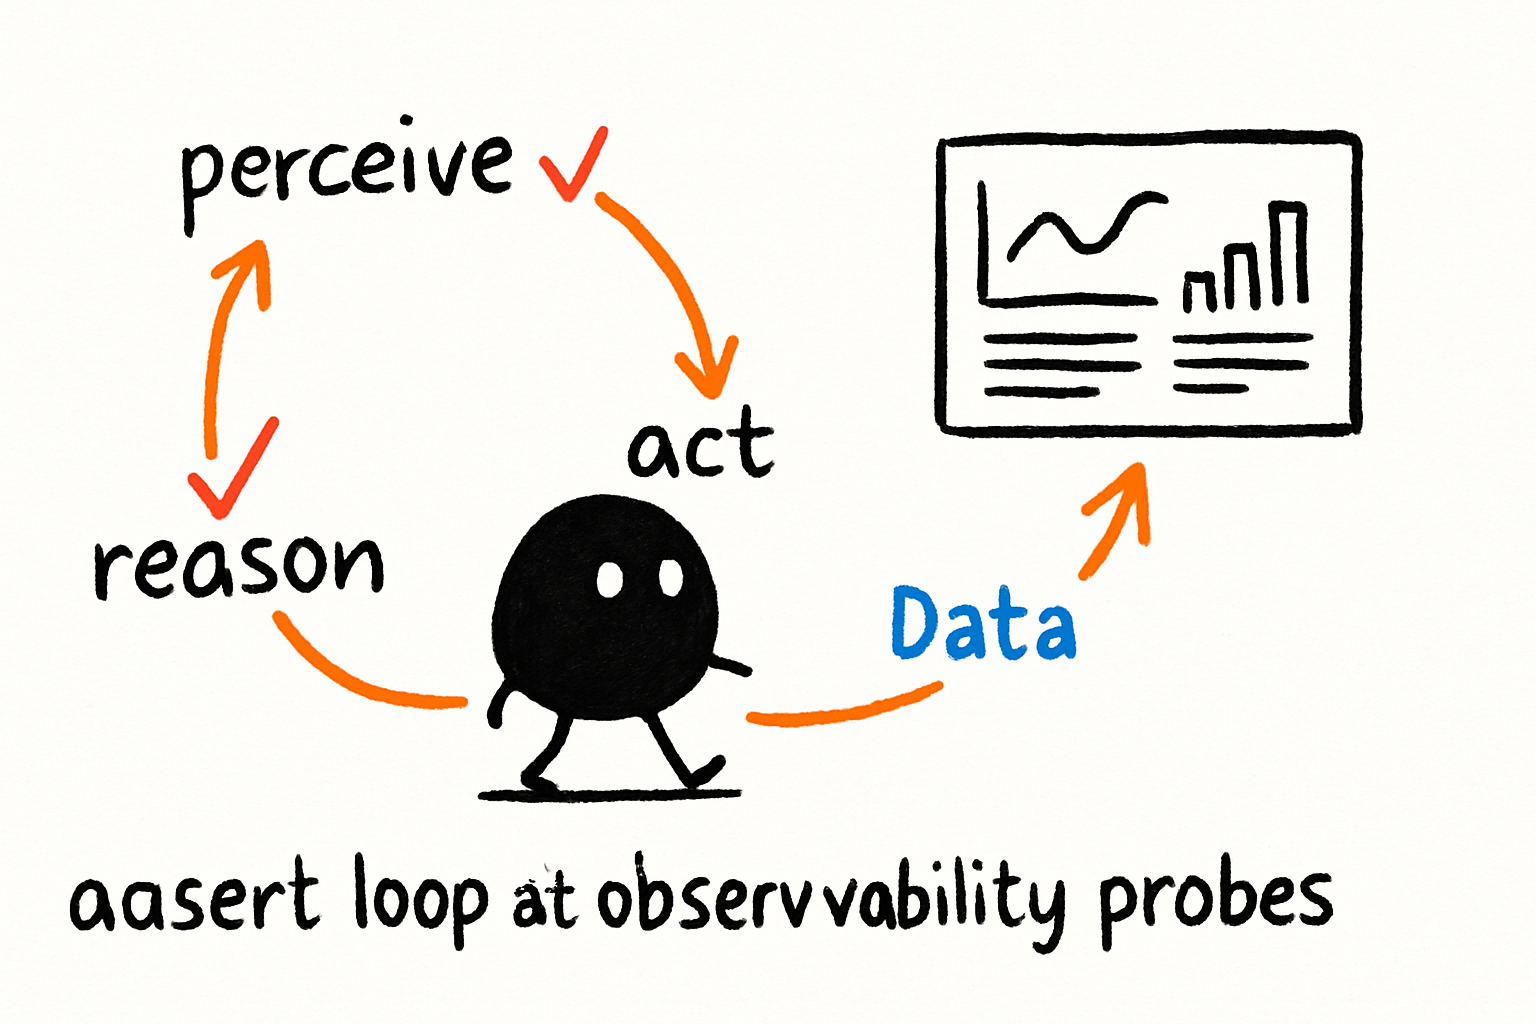
Observability in traditional software means understanding the internal state of a system by examining its outputs. For AI agents, it means something more specific: the ability to trace every decision, every API call, every context modification, and every failure mode as the agent moves through its loop.
An agent isn’t a single model call. It’s a cycle: perceive, reason, act, observe, repeat. Each step can introduce errors, drift, or unexpected behavior. Without observability, you’re flying blind — you see the final output, but you have no idea why the agent took that path or where it went wrong.
Production AI monitoring for agents must capture:
- The full context window at each step — what was in the system prompt, what tools were described, what conversation history was included.
- Tool call inputs and outputs — exactly what parameters were passed, what the API returned, and whether the agent handled errors correctly.
- Decision traces — why the agent chose one tool over another, including the reasoning (if the model exposes it) and the confidence scores.
- Latency breakdowns — how long each step took, where bottlenecks formed, and whether retries occurred.
- Cost per session — token usage for prompts, completions, and tool call overhead.
This isn’t just debugging. It’s the foundation for improving agent behavior. When you can see that an agent repeatedly calls the wrong tool because the tool description is ambiguous, you can fix the description. When you see context window compression stripping out critical instructions, you can adjust your context engineering.
Key Components: Tracing, Logging, and Monitoring in Agent Loops
Observability for agents requires three distinct layers, each serving a different purpose.
Tracing: The Agent’s Decision DNA
Tracing captures the complete sequence of events in an agent session. Unlike traditional request tracing, agent traces include the model’s internal reasoning, the exact prompt sent, and the full response. This is critical for understanding why an agent made a particular choice.
A well-structured trace should include:
- Session ID — links all steps in a single agent interaction.
- Step index — shows the order of operations, including parallel or nested calls.
- Input context — the exact text of the system prompt, user message, and any tool results fed back into the model.
- Output — the model’s response, including any tool call JSON or structured output.
- Timestamps — precise timing for each step.
- Error states — any exceptions, timeouts, or malformed responses.
Logging: Structured Data for Analysis
Logging provides the raw material for dashboards, alerts, and post-hoc analysis. For agents, logs should be structured and include:
- Token counts per step (input and output)
- Model ID and version
- Tools used and their results
- Context window utilization (how many tokens were consumed vs. the limit)
- Cost per step and cumulative cost
Structured logging enables you to query across thousands of sessions. You can ask: “Which tool calls fail most often?” or “At what point in the conversation does the agent start repeating itself?”
Monitoring: Real-Time Alerts and Dashboards
Monitoring is the layer that turns raw data into actionable signals. For agents, you need:
- Latency SLAs — alert if a single step takes longer than 10 seconds, or if the full session exceeds 60 seconds.
- Error rate spikes — sudden increases in tool call failures or model refusals.
- Cost anomalies — a session that consumes 10x the normal tokens might indicate a runaway loop.
- Context window pressure — alert when a session approaches the model’s context limit, as behavior often degrades near the boundary.
The New Stack article “Agents need boring infrastructure around them” makes a crucial point: the infrastructure that makes agents reliable is invisible when it works. Observability is that infrastructure. Without it, you can’t tell if your agent is improving or degrading.
How Context Engineering Enables Observability
Context engineering — the practice of designing what goes into the model’s context window — is the bridge between observability and agent behavior. If you can’t see what’s in the context, you can’t explain why the agent acted a certain way.
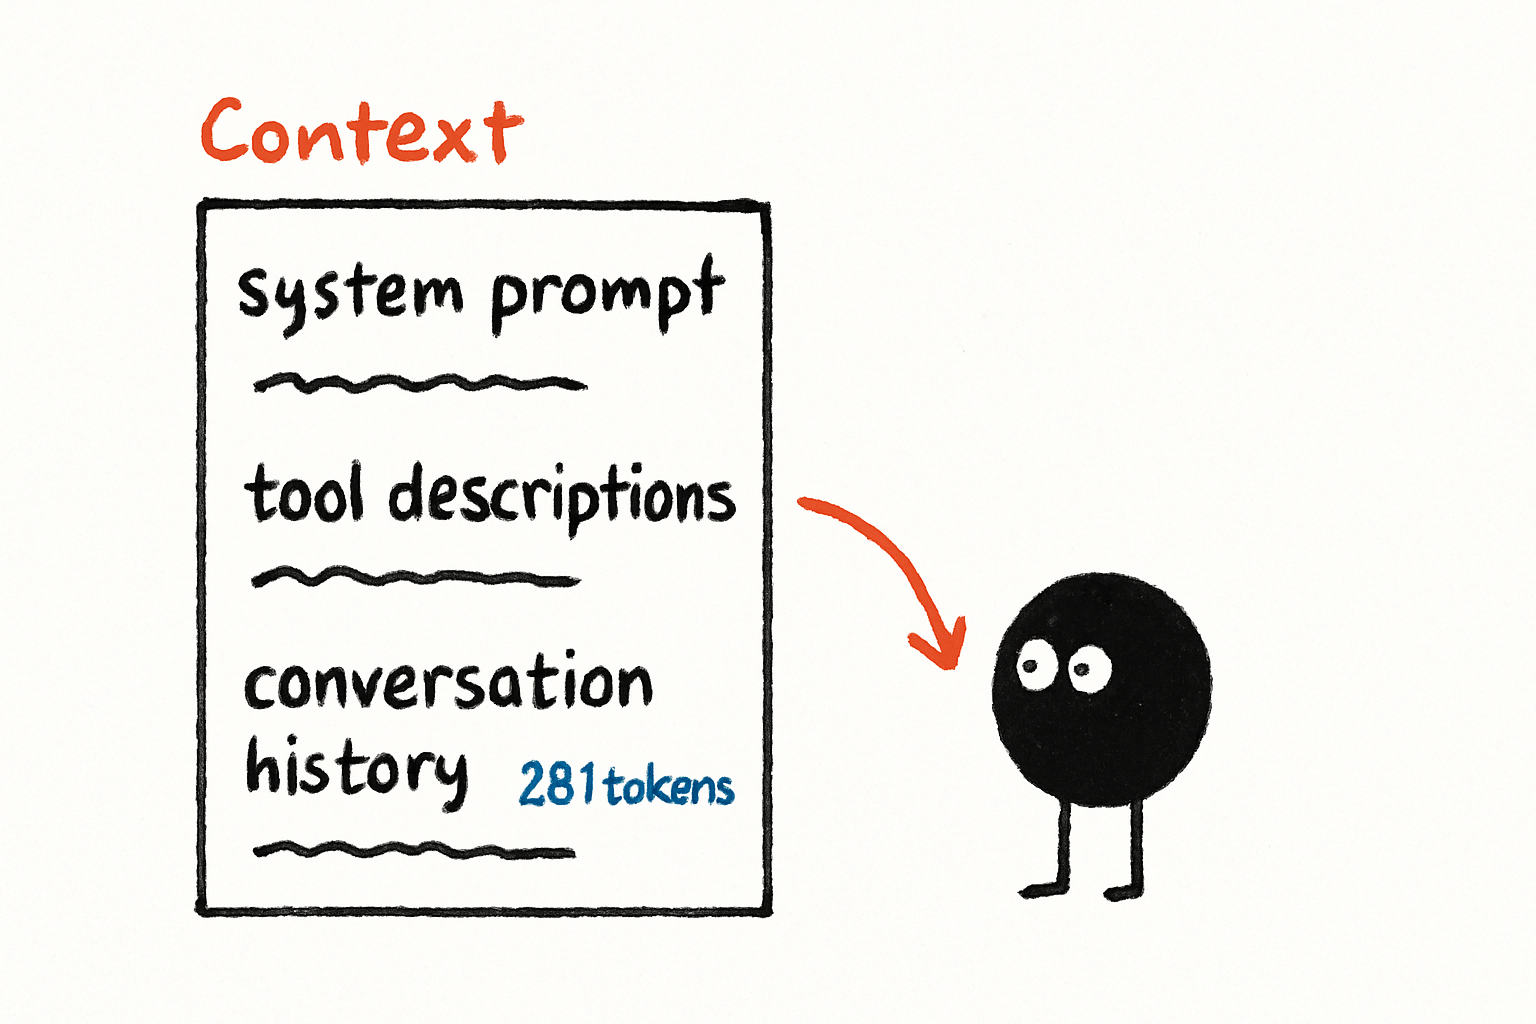
Every agent session has a context window that includes:
- The system prompt (instructions, guardrails, persona)
- Tool descriptions and schemas
- Conversation history
- Retrieved documents or data
- Intermediate results from tool calls
When an agent fails, the first question should be: “What was in its context at that moment?” If the context was missing a critical instruction, too large (causing the model to lose focus), or polluted with irrelevant data, the failure makes sense.
Observability tools should expose the context window at every step. This means:
- Logging the full system prompt — including any dynamic parts that change per session.
- Tracking context modifications — when you compress history, truncate documents, or inject new instructions.
- Measuring context utilization — how much of the available window is used, and whether content is being dropped or compressed.
- Auditing context injections — if your agent pulls data from external sources, log exactly what was retrieved and how it was formatted.
This is especially important for agents that use retrieval-augmented generation (RAG). If the retriever returns irrelevant documents, the agent’s context becomes noisy, and its behavior degrades. Observability lets you see that degradation and trace it back to the retrieval step.
Practical Steps to Implement Observability in Your Agent Stack
Building observability into your agent infrastructure doesn’t require a massive investment. Start with these concrete steps.
Step 1: Instrument Every Model Call
Wrap every LLM call with a tracer that captures:
- The exact prompt sent
- The model’s response
- Token counts
- Latency
- Error status
Use OpenTelemetry or a custom wrapper. The key is to make this non-negotiable — every call, every time.
Step 2: Log Tool Calls with Full Input/Output
When your agent calls a tool (API, database, function), log:
- The tool name and parameters
- The raw response from the tool
- Any error or timeout
- How the agent processed the result
This is where most agent failures hide. A tool that returns an unexpected format can cascade into a session-long failure.
Step 3: Build a Session Replay System
Create the ability to replay any agent session from start to finish. This means storing the full trace, including context windows, tool calls, and model outputs. When a customer reports a bad experience, you should be able to load that session and step through it like a debugger.
Step 4: Set Up Alerts for Common Failure Modes
Start with these three alerts:
- Runaway loops — if the agent makes more than 10 tool calls in a single session, flag it.
- Context overflow — if the session approaches 80% of the model’s context limit, alert.
- High cost sessions — any session that costs more than $1.00 in API calls.
Step 5: Use Observability to Improve Context Engineering
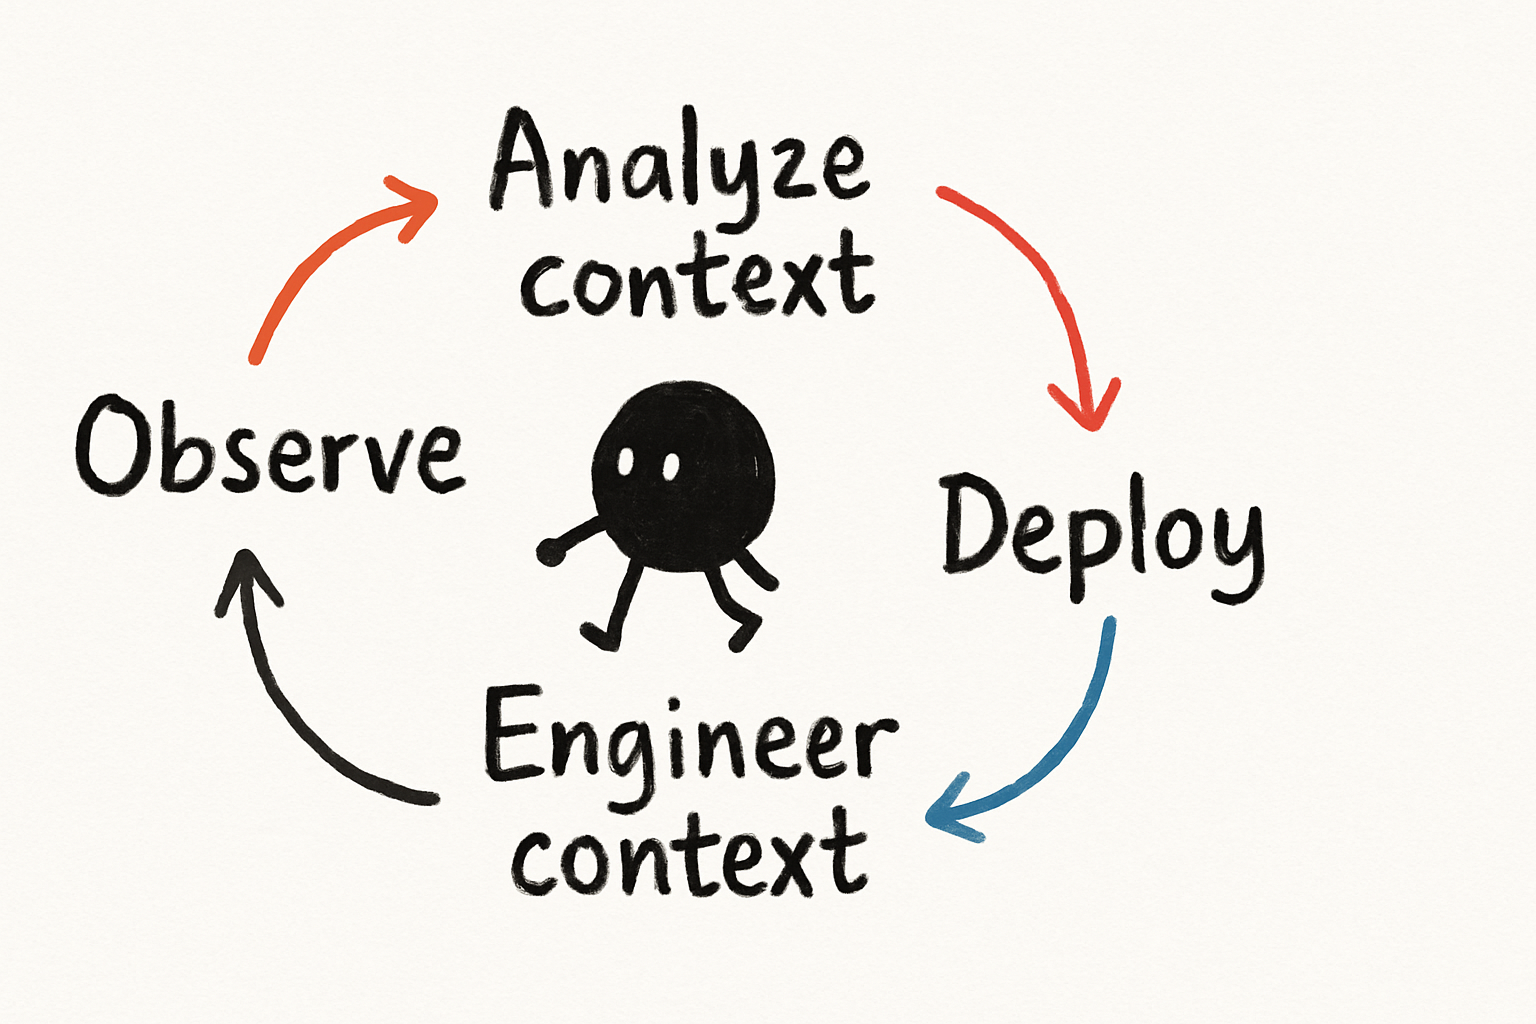
This is the feedback loop. When you see an agent failing, examine the context. Is the system prompt too long? Are tool descriptions ambiguous? Is conversation history bloating the window? Fix the context, then measure the improvement.
Key Takeaways
- Static benchmarks like LiveBench and LLM leaderboards measure narrow capabilities and don’t predict agent behavior in production. Use them for initial screening, not deployment decisions.
- AI agent observability requires tracing every step of the agent loop, logging structured data for analysis, and monitoring for real-time anomalies.
- Context engineering is the link between observability and agent improvement. You can’t fix what you can’t see in the context window.
- Practical implementation starts with instrumenting model calls, logging tool interactions, building session replay, and setting alerts for common failure modes.
- The goal is a feedback loop: observe, analyze, engineer the context, deploy, and observe again.
My Take
The industry is obsessed with benchmarks because they’re easy. You run a script, get a number, and declare victory. Observability is hard because it forces you to confront the messiness of real systems. But here’s the truth: the teams that win with AI agents won’t be the ones with the highest leaderboard scores. They’ll be the ones who can debug a 50-step agent session in five minutes, who can trace a hallucination back to a poorly written tool description, and who can measure improvement in production, not just on a test set.
Invest in agentic infrastructure that makes your agents observable. That boring infrastructure — logging, tracing, monitoring, context auditing — is what separates demos from production systems. Benchmarks are a snapshot. Observability is a live feed.
Key Takeaways
- Static benchmarks don’t predict agent behavior in production. Observability does.
- Trace every model call, tool interaction, and context modification.
- Log structured data: token counts, costs, latencies, errors.
- Monitor for runaway loops, context overflow, and cost anomalies.
- Use context engineering as the feedback loop for agent improvement.
- Build session replay to debug any agent interaction from start to finish.
What’s the difference between monitoring an API endpoint and monitoring an AI agent?
Monitoring an API endpoint typically tracks request volume, latency, and error rates. Monitoring an AI agent requires tracing the decision loop — what context was in the prompt, which tools were called, how the agent processed results, and why it chose a particular action. You need session-level visibility, not just request-level metrics.
How do I start implementing observability for my agents without a dedicated platform?
Start by wrapping every LLM call with a function that logs the full prompt, response, token counts, and latency. Use a simple structured logger (JSON to stdout or a file). Add tool call logging with input/output pairs. Build a basic dashboard with Grafana or a similar tool. This gives you 80% of the value with minimal infrastructure. Scale to dedicated tools like Langfuse or Arize when you need session replay and advanced tracing.